
Venn Diagram
A Venn Diagram is a picture of the relationships between sets. In a Venn diagram, the sets are represented by circles. The elements of a set are labeled within the circle.
This picture represents the set "Whole numbers below 6":
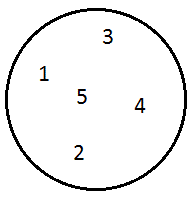
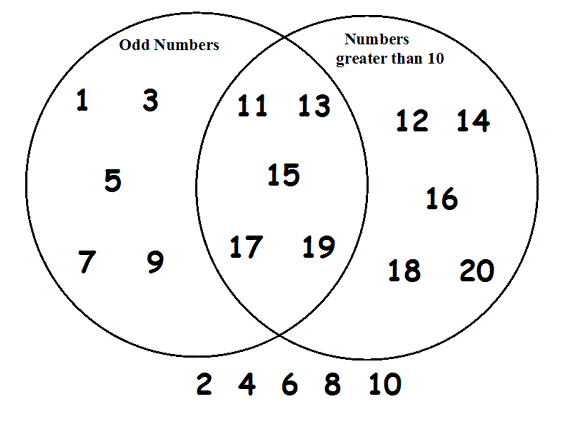
Everything in the diagram, even things outside the circles, is called the Universal Set. A Universal Set is the set of all elements under consideration. In our diagram, the universal set is all whole numbers less than 21.
When 2 circles overlap, that means that there are members of the first set that are also members of the second set.
You can see that 11, 13, 15, 17 and 19 are members of the set of odd numbers and also the set of numbers greater than 10.
Also note that 2, 4, 6, 8, and 10 are not members of either set but are members of the Universal Set.
|
→
|
Universal Set = all whole numbers below 21
|
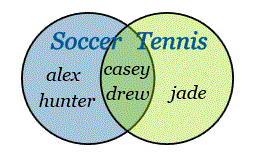
You can put almost anything in a Venn diagram, even your friends! Let's suppose that you have friends who play tennis and friends who play soccer. Here are their Venn diagrams:

|
Notice that there are 2 friends who play both (Casey and Drew).
You can show that by overlapping their circles like this:
|
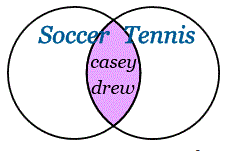
If you want only the friends that play both sports, you represent them like this:
|
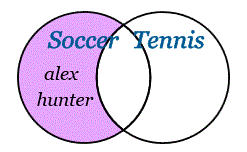
And, if you are looking for soccer players who don't play tennis, that looks like this:
|
Get the picture?
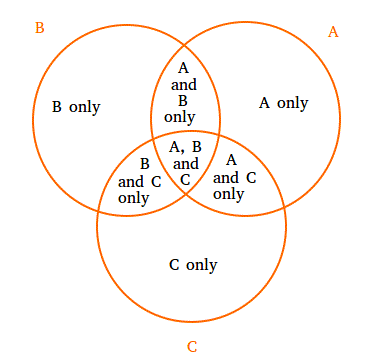
This diagram shows what the overlap areas of 3 different sets mean:
|
Here's a very common example:
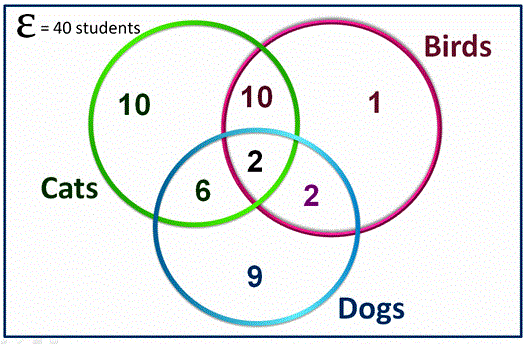 The pets of 40 students. Suppose that a class of 40 students (the Universal Set) has cats, dogs and birds as pets. This diagram shows how many students have pets of each type. Here are the answers to a few questions about these pets (the last one is for you!): The pets of 40 students. Suppose that a class of 40 students (the Universal Set) has cats, dogs and birds as pets. This diagram shows how many students have pets of each type. Here are the answers to a few questions about these pets (the last one is for you!):
1. How many students have cats as pets? (10+10+6+2 = 28)
2. How many have both cats and dogs as pets? (6 + 2 = 8)
3. How many have a cat, a dog and a bird? (2)
4. How many have cats and birds but no dogs? (10)
5. How many have dogs and birds but no cats? _____
|
|
|


